Working with Satellite Data
PiperABM can seamlessly ingest satellite imagery and geospatial datasets to build simulation-ready infrastructure models. Below are guides to help you import, preprocess, and integrate satellite data into your modeling workflows.
Mercator Projection
As we already saw in the Step 1: Build the Infrastructure section of the Step-by-Step Usage Guide, the PiperABM framework expects x, y coordinates for the positions. However, many satellite datasets and maps provide data in latitude and longitude coordinates. To convert these coordiantes to x and y, we can use the Mercator projection.
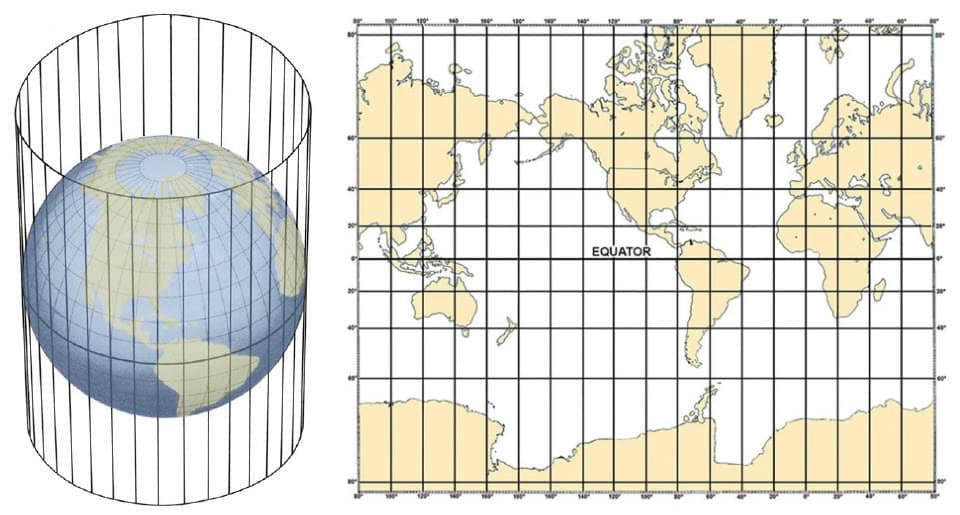
Figure 1: The Mercator projection is a cylindrical map projection. Imagine wrapping a piece of paper around a globe to form a cylinder. The map image is what’s projected from the 3D globe onto the 2D surface of the paper. Source: NOAA
In this transformation, the reference point is the latitude and longitude of a specific location, which will become the origin (0, 0) in the x, y coordinate system. The Mercator projection, as seen in Figure 1, wrapps the 3D globe and distorts the shapes. The areas closer to the reference point will be more accurate and less distortedm while areas further away will be more distorted. This is important to keep in mind when working with large areas or when the reference point is not centrally located.
from piperabm.tools.coordinate.projection import latlong_xy

# Reference point
latitude_0 = 40.0520
longitude_0 = -74.0232

# Points in latitude and longitude
points = [
    [40.7128, -74.0060],
    [40.0522, -74.0240],
    [40.1234, -74.0567],
    ...
]

# Convert to x, y coordinates using Mercator projection
for point in points:
    x, y = latlong_xy(
        latitude_0,
        longitude_0,
        latitude=point[0],
        longitude=point[1]
    )
    print(x, y)
For further details on how to use the Mercator projection for modeling using PiperABM, refere to this example.
Meshing Residential Areas
To add home nodes to the model, we already see that we can use the add_home method of the Infrastructure class. However, it is not always practical to add hundreds or thausand of homes one by one. When working with satellite data and maps, we can create mesh patches that represent and cover the residential areas. These patches are then used to generate random points that represent the homes in the model.
To do so, first, we define the points that form the vertices of the triangles (Figure 2(a)). If the points are in latitude and longitude, convert them to x and y coordinates using the Mercator projection that has been discussed above. Then, we create Triangle instances for each triangle formed by the points. Finally, we create a Patch instance that contains these triangles (Figure 2(b)). The Patch instance can then be used to generate random points within the defined area. Another capability of the Triangle is that it can have a density atttribute, defaulting to 1, which controles chance of point generation in the area. This is useful since not all residential areas have the same density of homes.
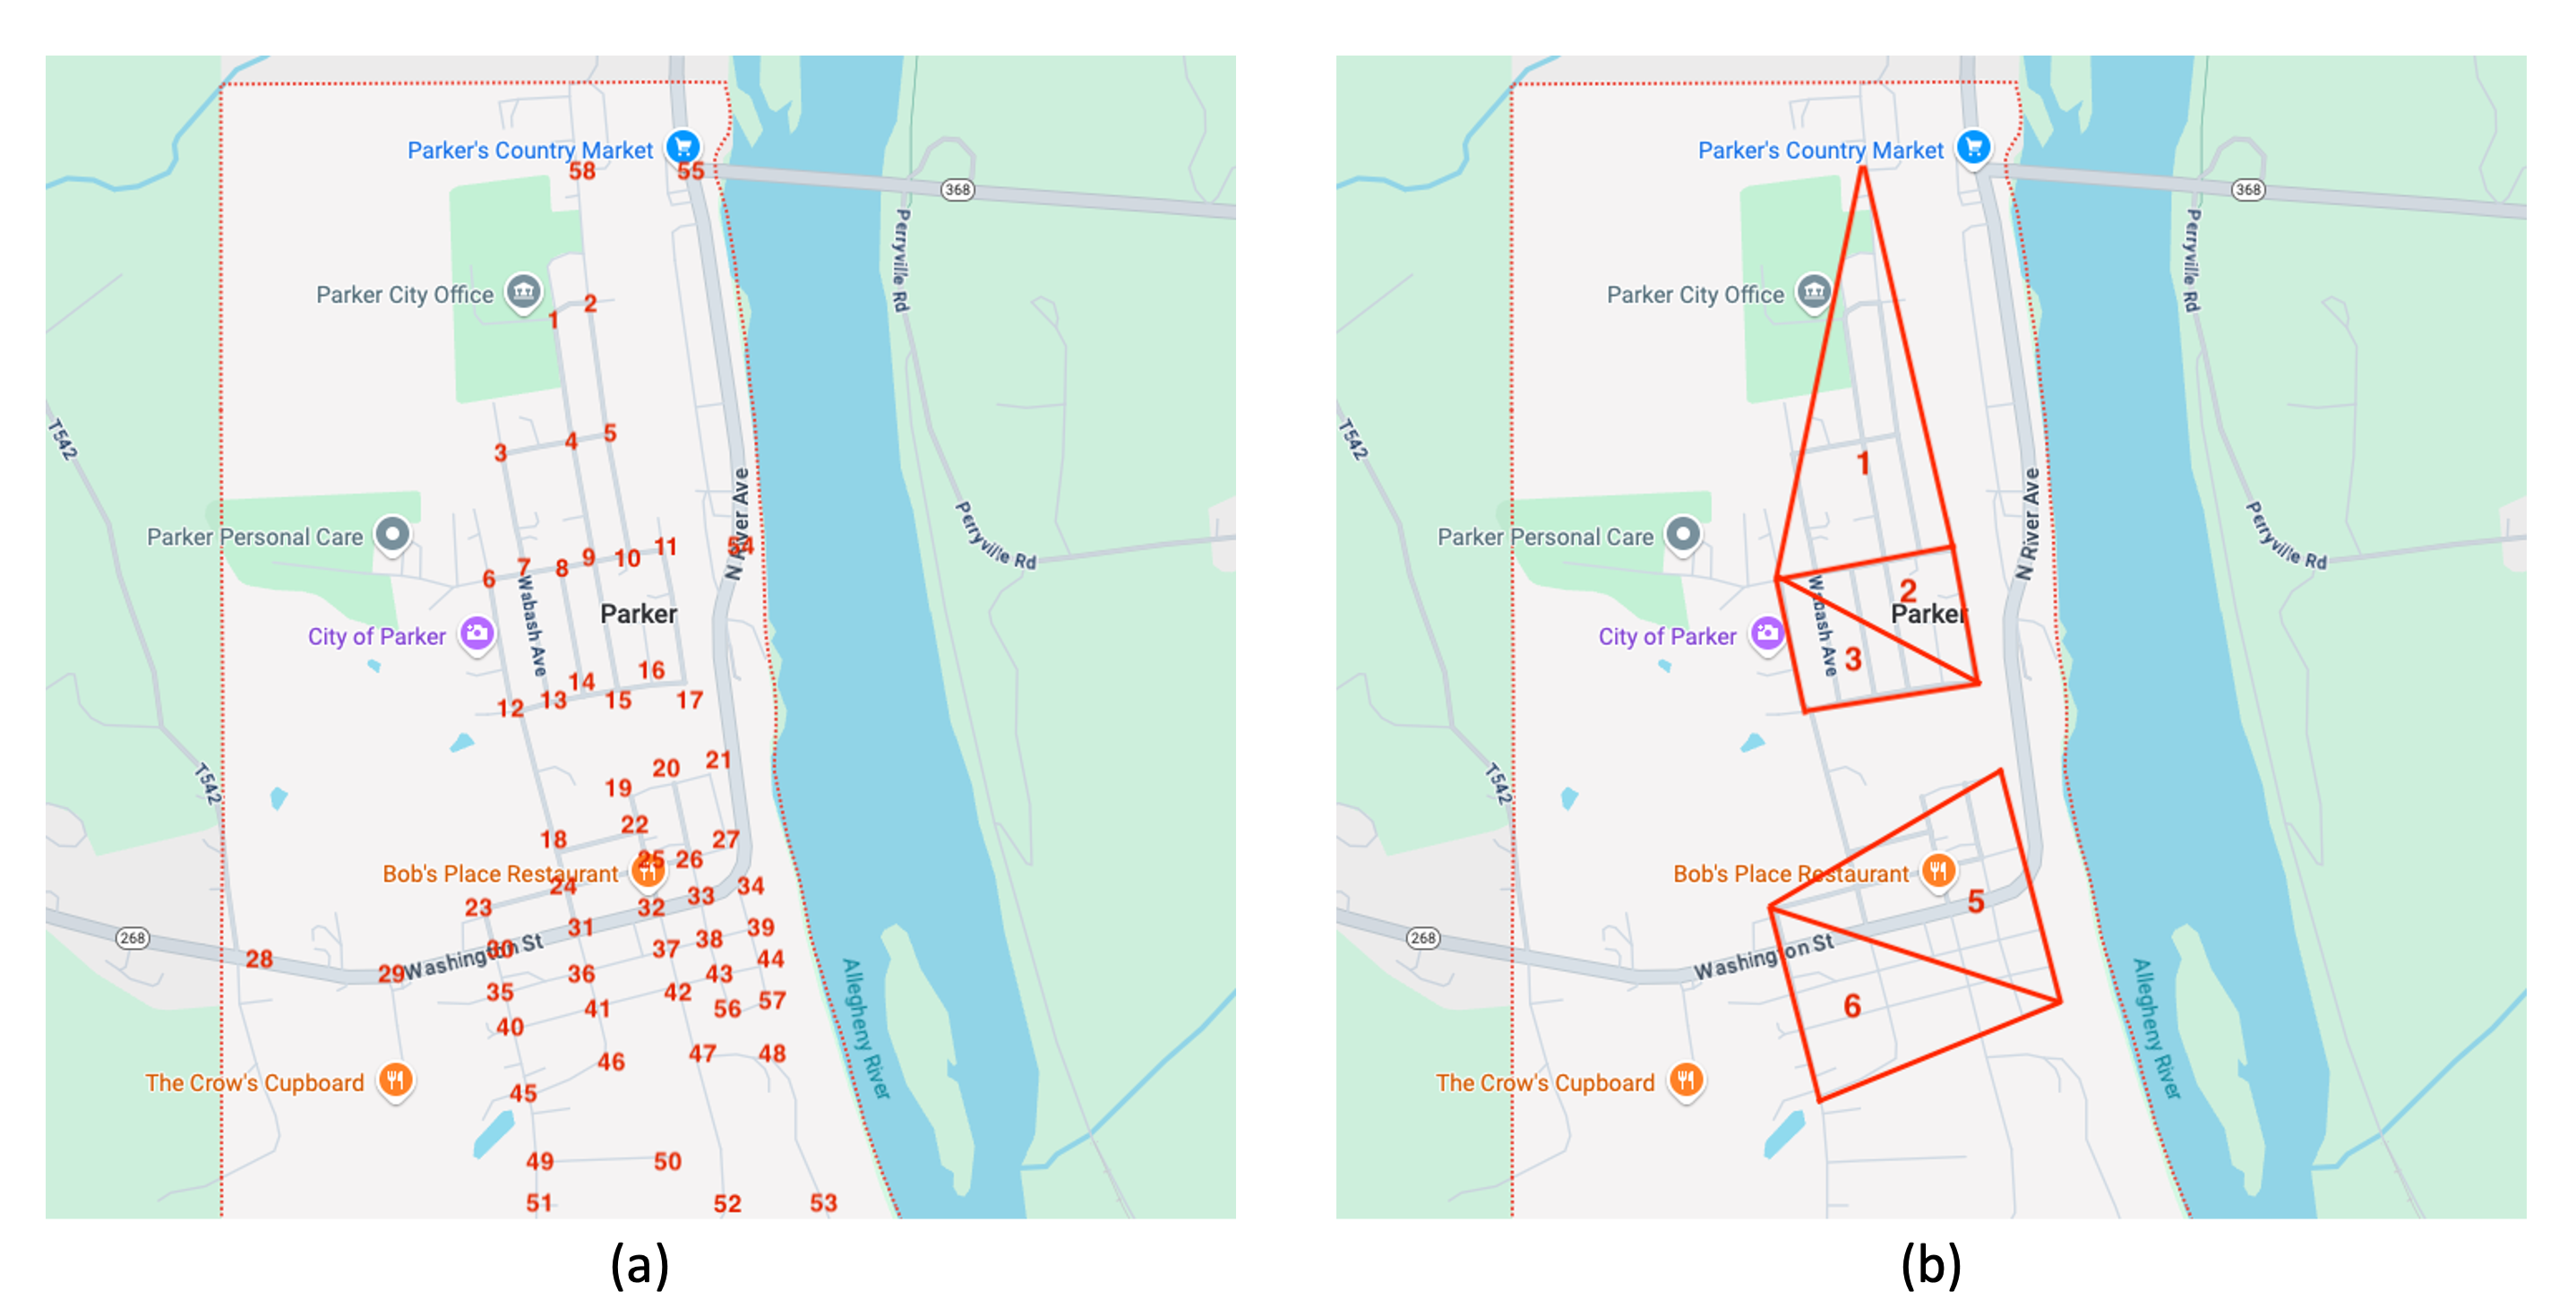
Figure 2: (a) Points are labeled and their coordinates are extracted. These points will either/or be used for defining streets and creationg of homes nodes. (b) The mesh patch is created using the points as the vertices of the triangles. Home nodes will be placed randomly inside this area.
import piperabm as pa
from piperabm.tools.mesh import Triangle, Patch

model = pa.Model()

# We define the points that from the vertices of the triangle.
# Figure 2(a)
point_1 = [0, 0]
point_2 = [10, 0]
point_3 = [10, 12]
...

# Then, we create define the triangle formed by the points.
# Figure 2(b)
triangle_1 = Triangle(point_1, point_23, point_8)
triangle_2 = Triangle(point_3, point_43, point_5)
triangle_3 = Triangle(point_6, point_52, ponint_27)
...

# We create a Patch instance that containts these triangles.
patch = Patch([
    triangle_1,
    triangle_2,
    triangle_3,
    ...
])

# We can now generate random points within the defined area.
for _ in range(100):  # Generate random points
    point = patch.random_point()
    model.infrastructure.add_home(pos=point, name='home')
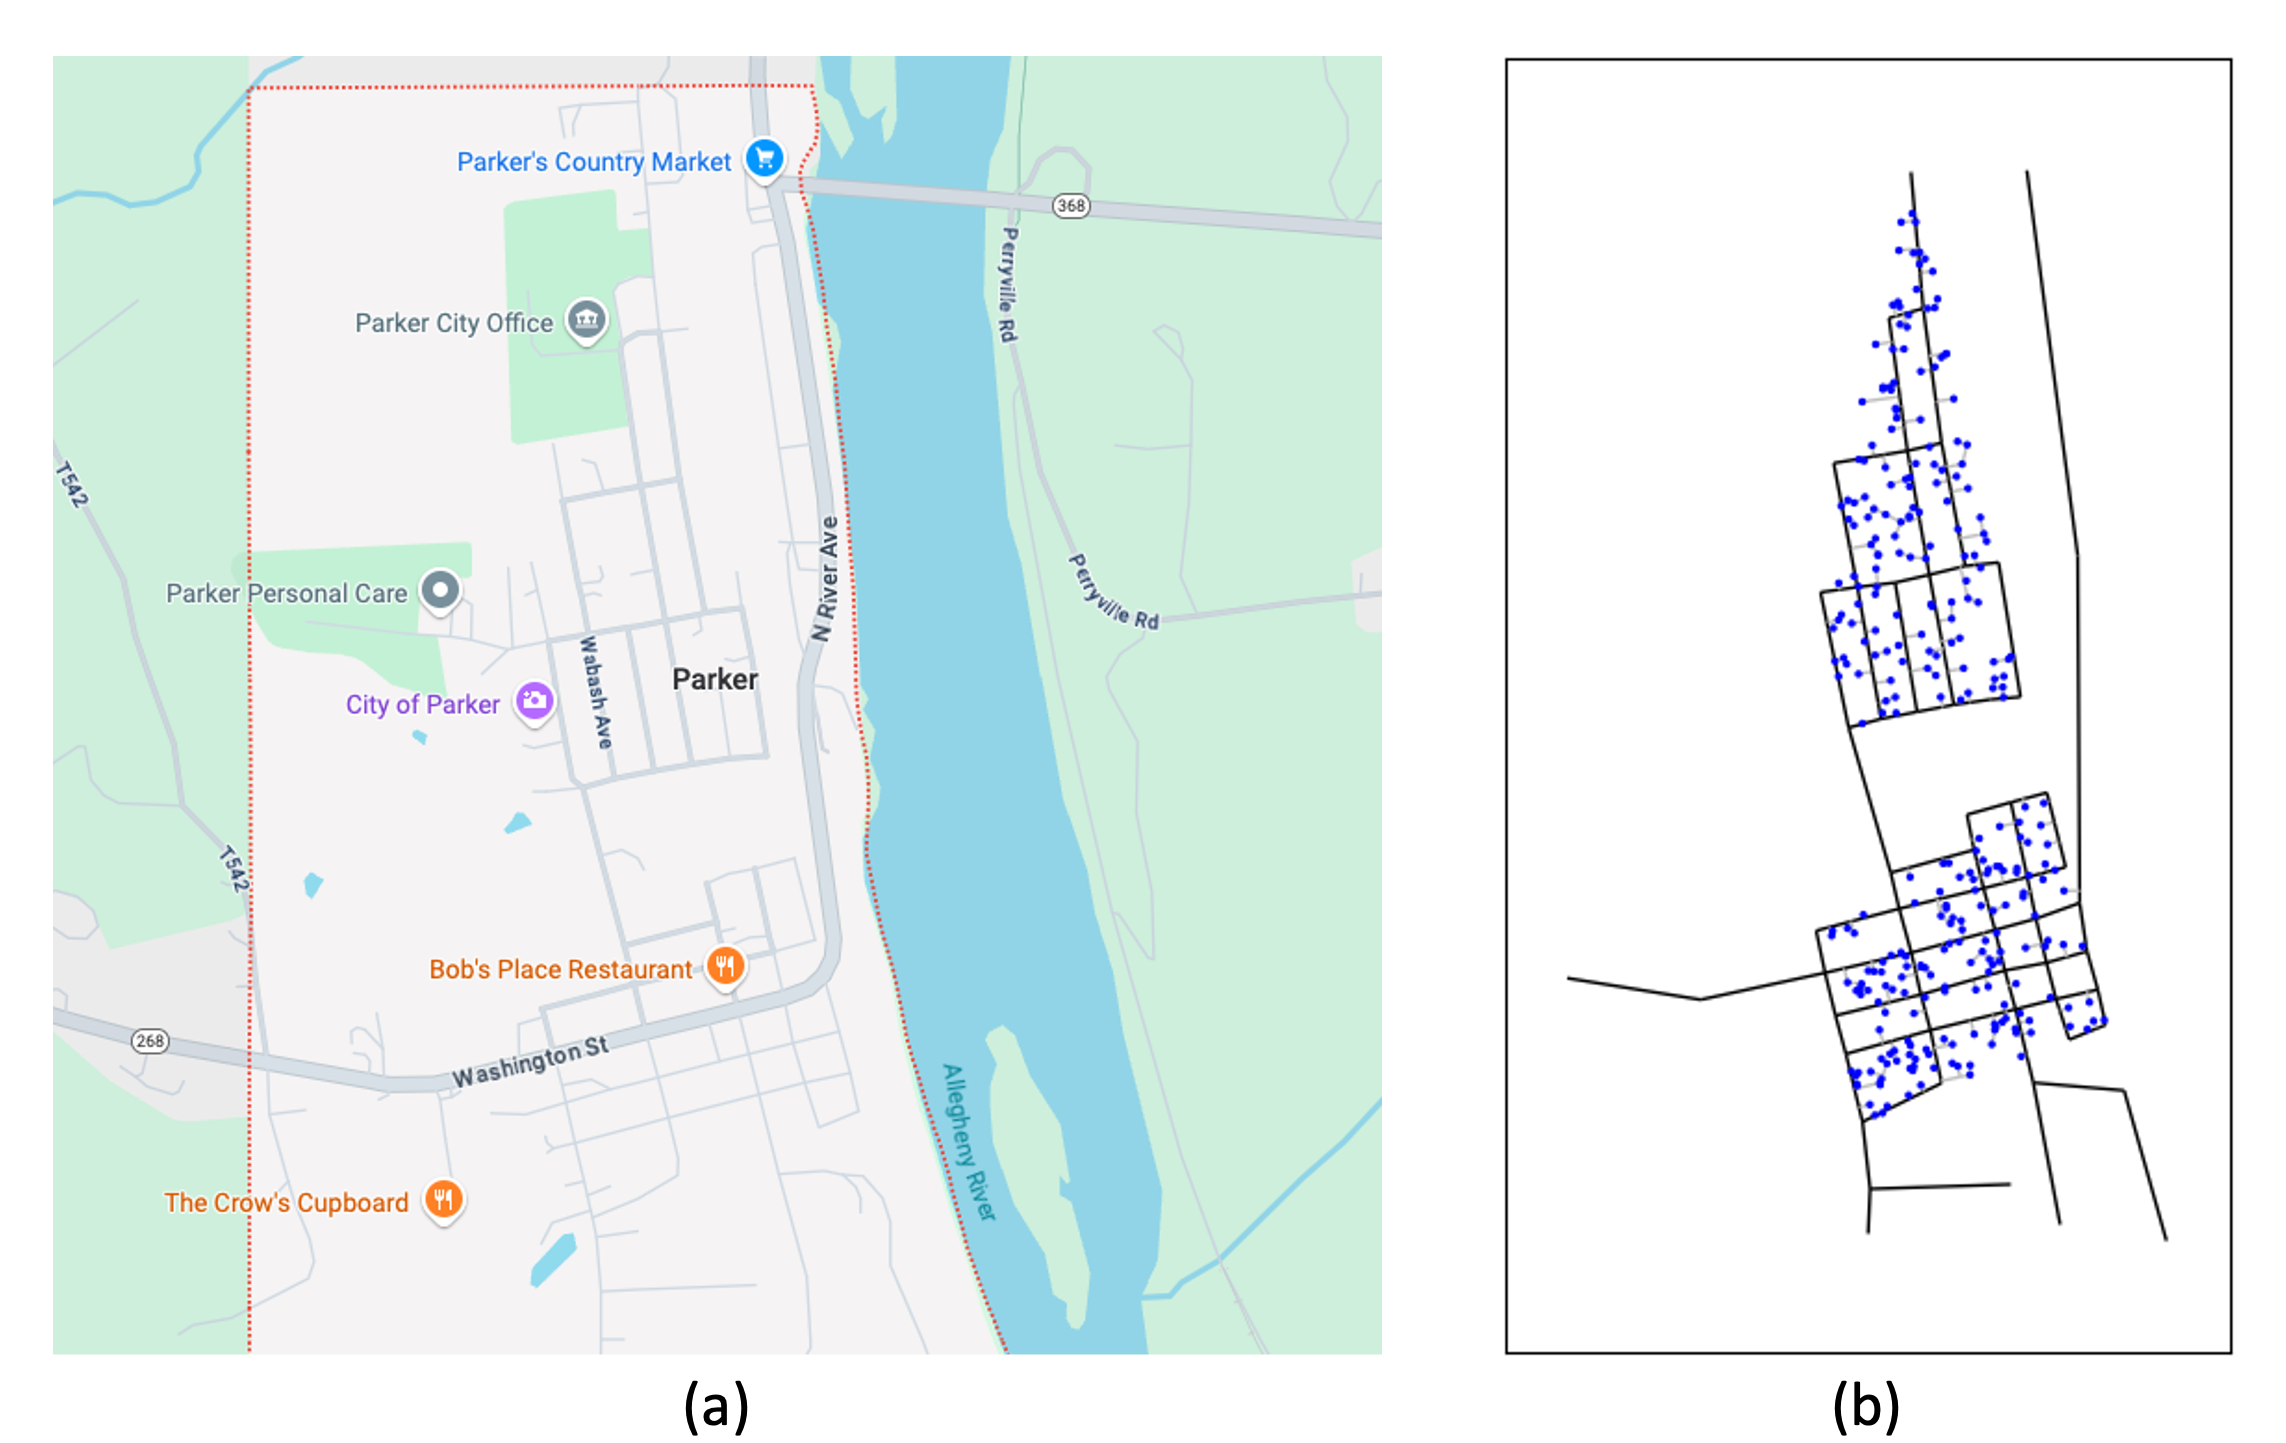
Figure 3: (a) The input map. (b) The modelled infrastructure with homes, streets, and neighborhood access edges. The homes are randomply placed in residential areas.
For further details on how to use meshing to generate homes in residential areas, refere to this example.